
A 34% operating margin and a share price sitting meaningfully below its peak: those two facts should not coexist in a simple story. Either the margin is under pressure from the capital cycle, or the current price reflects assumptions about durability that the filed numbers do not yet confirm, and the evidence for each side is what this piece examines.
In one breath
Alphabet’s Q2 2026 filing shows operating margins at 34%, a level the company has never sustained across a full year. Our data puts the stock’s price-to-sales ratio at the 92nd percentile of its own decade, meaning the market is paying a historically high premium per dollar of revenue. The open question is whether a capital expenditure program of this scale will compress those margins, and whether the current valuation already prices in that risk or does not, or whether Cloud’s acceleration makes the spending look cheap in hindsight.
The margin the filing shows
Alphabet spent most of the 2010s as a single-product company wearing a conglomerate’s name. The 2015 restructuring into a holding company was meant to give investors a cleaner view of the core advertising engine and the moonshots burning cash around it. For years, that transparency mostly confirmed what everyone suspected: Search was extraordinary, and everything else was expensive.
Then the numbers started moving. The 10-K filed February 5, 2026 shows full-year 2025 net income of $132 billion on revenue of $403 billion, a net margin of roughly a third. That is not a rounding error above the company’s own history: the business earned dramatically more per dollar of sales in 2025 than it did five years earlier, and it did so while revenue itself nearly doubled.
The Q2 2026 operating margin of 34% extends that trend into the current year. For a business of this scale, that figure means something concrete: for every dollar a customer or advertiser sends Alphabet, thirty-four cents survive after paying every employee, every server lease, and every office light bill. A typical large manufacturer keeps about eight cents. The gap is what makes software businesses so interesting to study, and so dangerous to overpay for.
The margin the price assumes
Here is where the math and the mood diverge. “The math” is what the filed numbers justify on their own terms; “the mood” is what the market is currently willing to pay on top of that. Right now, the mood is generous.
Our data puts Alphabet’s price-to-sales ratio at the 92nd percentile of the company’s own history. A price-to-sales ratio is simply how many dollars the market pays per dollar of annual revenue, the way a buyer might pay ten times a shop’s annual sales to acquire it. Paying at the 92nd percentile of your own history means the market is betting that the next chapter is better than roughly nine of the last ten. The price-to-earnings multiple tells a similar story: elevated relative to the company’s own decade median, though not dramatically so on its own.
IF margins compress materially from current levels, the arithmetic of a 92nd-percentile price-to-sales ratio would require either a significant re-rating of the multiple or an acceleration in revenue growth to remain internally consistent, two scenarios with different implications that the filing does not yet resolve. And compression risk is exactly what the capital expenditure guidance is advertising.
The bill arriving in 2026
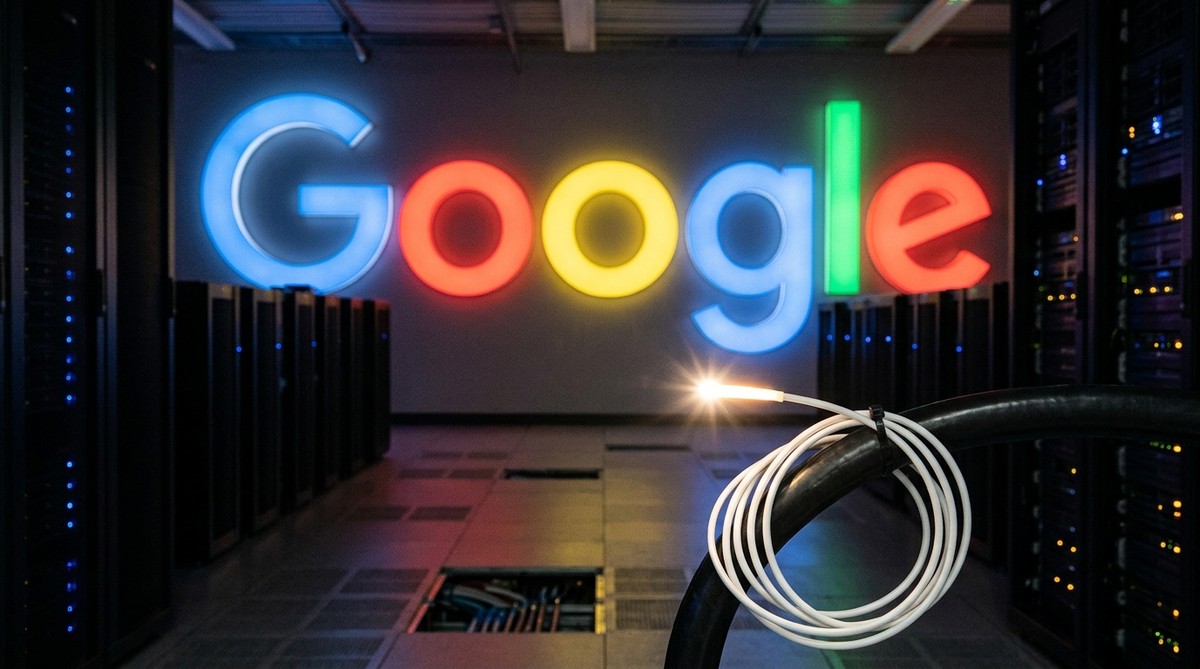
The Q2 2026 earnings call on July 22 carried a number that stopped several analysts mid-sentence: Alphabet raised its full-year capital expenditure guidance to roughly $200 billion. Capital expenditure is the money a company spends on physical assets, servers, cables, buildings, the infrastructure that future revenue runs on. Think of it as the renovation bill a restaurant pays before it can seat more diners.
To feel the scale: the 2025 10-K shows Alphabet spent $91 billion on capital expenditures last year. The new guidance is more than twice that, in a single year. The consequence showed up immediately: free cash flow for Q2 turned negative, meaning the spending ran ahead of the earning, at least for now (Motley Fool, October 2026). Free cash flow is the money left after all spending, the cash a business can actually return to shareholders or reinvest freely. Negative free cash flow at a company generating enormous operating income in a single quarter is not a crisis, but it is a signal worth watching.
Management’s argument, made explicitly on the Q2 call, is that the constraint is capacity, not customers. Google Cloud’s revenue grew more than 80% year-over-year in Q2, and the backlog of signed but undelivered contracts reached $514 billion, with more than half expected to convert within two years. That backlog is larger than the entire company’s annual revenue. If the conversion rate holds, the spending looks prescient. If it slips, the margin story changes fast.
Where Cloud changes the arithmetic
Google Cloud reached a 35.6% operating margin in Q2 2026. That matters because Cloud was losing money as recently as a few years ago. A business segment that flips from loss to a margin matching Search in roughly three years does not behave like a mature advertising market; it behaves like a business still finding its ceiling.
As reported by Admiral Markets in an October 14, 2026 earnings preview (note: this characterisation derives from a secondary source rather than a primary Deepwater publication), Gene Munster of Deepwater Asset Management was cited as arguing that Meta’s new Muse personal AI agent poses a more serious threat to Google’s search advertising revenue than ChatGPT has, because Muse’s transactional design could route commercial queries around Google entirely. Search advertising generated tens of billions in Q2 2026 alone. If even a modest fraction of that traffic migrates, Cloud’s margin expansion would need to accelerate further just to keep the total margin flat.
That is the real tension inside the filing: two businesses moving in opposite directions at the same time, inside one stock price.
Reading the numbers
- 34% operating margin, Q2 2026 (10-Q, June 2026): what it is, the share of each revenue dollar surviving after all operating costs. What it means here: this is the highest sustained margin in Alphabet’s history, up from 21% in 2022. In everyday terms, a corner store keeping 34 cents of every dollar after rent, wages, and stock would be considered extraordinary; most keep five to eight cents.
- P/S ratio 10.7, at the 92nd percentile of the decade (our data): what it is, the price paid per dollar of annual revenue. What it means here: the market is paying more per dollar of Alphabet’s sales than it has in roughly nine of the last ten years. A household analogy: imagine paying $10.70 for a jar of jam that has historically sold for $6.70, because the jam has been unusually good lately and the buyer expects it to stay that way. Analyst consensus price targets as of October 2026 are also tracked by external sources (Beinsure), though BullScope’s percentile figure derives from our own historical data series.
- $195 billion to $205 billion capex guidance, full-year 2026 (raised July 22, 2026): what it is, the planned spend on servers, data centers, and networking. What it means here: this is more than twice the $91 billion spent in all of 2025. A household earning $100,000 a year and planning to spend $50,000 on a home extension would feel this ratio; the extension may raise the home’s value, but the bills arrive before the appraisal does.
- $514 billion Cloud backlog (10-Q, June 2026): what it is, signed contracts not yet converted to revenue. What it means here: more than a full year of Alphabet’s total 2025 revenue is already committed by Cloud customers. If conversion holds, the capex spending is building for a known order book, not a speculative one.
For the standing yardsticks on Alphabet: the price tag, the filed record, and the four gauges, refreshed with each edition, see the BullScope Evidence Sheet: Alphabet.
Sources
- Alphabet 10-Q, quarter ended June 30, 2026 (SEC EDGAR)
- Alphabet 10-K, fiscal year ended December 31, 2025 (SEC EDGAR)
- Alphabet Q2 2026 Earnings Call (abc.xyz investor relations)
- Alphabet Q2 2026 Earnings Call transcript (Betafinch)
- Alphabet raises 2026 AI infrastructure spending target to $205 billion (Konsulteer)
- Alphabet stock Q3 2026 earnings preview, citing Gene Munster as reported by Admiral Markets (secondary source)
- Alphabet stock price forecast, analyst consensus October 2026 (Beinsure)
- Alphabet negative free cash flow: why it matters (Motley Fool, October 2026)
Disclosure: BullScope holds no position in any security mentioned in this article. This article is impersonal financial analysis published for informational purposes only and does not constitute individualised investment advice or a recommendation to buy or sell any security. BullScope is a publisher of financial research and is not registered as an investment adviser; this content is provided solely for analytical and educational purposes and is excluded from the definition of investment advice under the Investment Advisers Act of 1940.