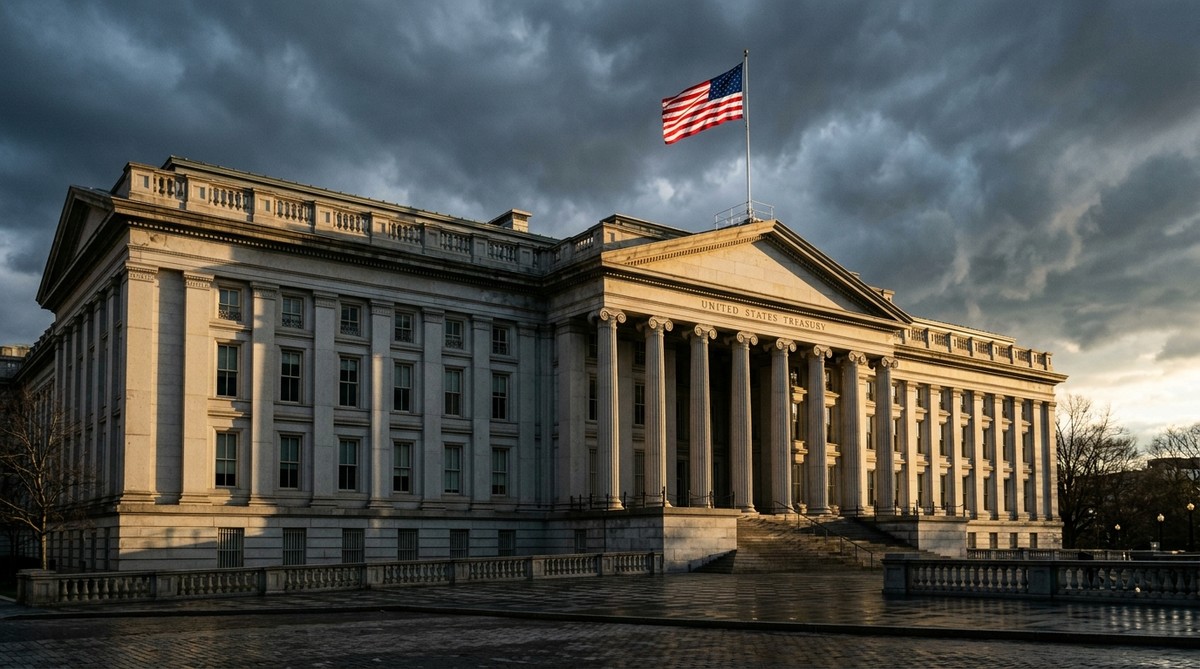
Sometime in the next few days, the total federal debt of the United States will pass $40 trillion. There will be no vote and no announcement. The Treasury updates the figure every afternoon on a public website, and one afternoon soon the first digit will be a 4. As of Monday, August 17, the count stood at $39.99 trillion, about $13 billion short of the line. Washington can borrow that much in a morning.
The short version
The federal government paid $1.17 trillion in interest over the past ten months, about $3.8 billion a day. The money to pay it is itself borrowed. Nearly $7 trillion of the debt comes due within a year and must be borrowed again at whatever rate the market sets, and by Treasury’s own table that short-term money is now the most expensive debt on the books. That setup makes the government the biggest winner from any future rate cut. The last time the debt was this heavy next to the economy, in 1946, Washington escaped without repaying a dollar early. It held interest rates down and let inflation shrink the dollars it owed. The people who had lent the money found, two years later, that it bought about a fifth less.
The bill nobody voted for
Start with what the debt already costs. In the first ten months of this fiscal year, October through July, interest expense came to $1.17 trillion. About $900 billion of that went to outside lenders. The rest is interest the government owes its own trust funds, Social Security’s among them.
Every other giant line in the federal budget was voted into existence and is defended by someone. Interest is different. It has no program behind it, no voters, and no off switch. It is simply the cost of every deficit ever run, and it gets paid before anything else does.
Seven trillion dollars on a short fuse
How the debt is structured matters as much as its size. Just under $7 trillion of it sits in Treasury bills, IOUs that come due in a year or less, many in a matter of weeks. That portion is never really paid off. It is borrowed again, continuously, at whatever rate the market demands that morning. Imagine a mortgage that resets every three months. That is now the government’s position on about a sixth of everything it owes.
Here is the whole arrangement at kitchen-table size. Take away nine zeros. A family owes about $40,000 on a credit card. This year they put about $2,100 more on the card, and $1,170 of that was not new spending. It was just the interest coming due. They are borrowing to pay the interest, the card paying the card. For a normal family, that is the last chapter.
One strange advantage keeps this family standing. Every year they get a raise, and the raise has usually been bigger than the card’s rate. The card charges about 3.4%. Their pay went up 6.5% last year. Run that for a few years and something odd happens. The balance keeps growing, and the debt keeps getting easier to carry anyway, because the paycheck grows faster than the debt does. That is America’s actual deal. The paycheck is the whole U.S. economy. No bank offers a family that arrangement.
Now look closer at the raise, because most of it was not a real raise. Only about a third of it came from the family truly earning more, the country making and selling more things. The other two thirds was prices going up at the store. Higher prices push more dollars through the same hands for the same work. America’s raise is mostly inflation.
To see who carries that, add the missing chair at the table. Somebody lent the family the $40,000. Call him the retired neighbor, who handed over his savings in exchange for the family’s IOU. The family pays him every dollar it promised, on time, every year. Count the checks and his record is perfect. But he lent dollars that each bought a full cart of groceries, and while the loan runs, prices climb. Whenever prices climb faster than the interest he collects, the dollars coming back to him buy thinner carts than the ones he handed over. Count the groceries and he is coming up short. Both counts are true at the same time, and only the checks show up on paper.
Today the neighbor is roughly treading water. The government pays him about 3.4% on average, and prices are rising about 3.3% a year, so his interest and the grocery store nearly cancel out. He is not losing much. He is simply not being paid for waiting. The time he truly drowned was the last time the debt got this heavy, right after World War II, when his long-term interest was capped at 2.5% by wartime policy while prices jumped 29% in two years. That story is just ahead. It is not a prediction. It has happened once already, and a milder version of the same arithmetic is running right now.
Treasury’s own average-rate table holds a second detail, a stranger one: the bills are currently the most expensive debt on the books. Bills carry an average rate of 3.76%, while notes average 3.31% and the old long bonds 3.44%. The shortest borrowing now costs more than the longest.
There is a logic to paying that premium. A bill’s cost falls within weeks of any rate cut, not decades. A government holding $7 trillion of them is positioned to save enormous sums the moment rates come down, which is worth keeping in mind as the debate over the Federal Reserve’s next move plays out.
The Fed’s uncomfortable arithmetic
Economists have a term for what happens when a debt grows this large: fiscal dominance. Stripped of jargon, it means the central bank can no longer set interest rates purely to manage inflation and jobs, because every rate decision is now also a decision about the government’s own financing costs.
No conspiracy is required to see the pressure. It is arithmetic. One full point of higher rates adds roughly $70 billion a year to the cost of the bill stack alone, and quickly, because the bills pick up the new rate as they roll over. One point of cuts removes the same amount just as fast. The 10-year Treasury yielded 4.72% on Monday, and every bond sold at that level locks its cost in for a decade. Each month spent rolling short-term bills instead keeps the option of cheaper refinancing alive. Whoever chairs the Fed, under whichever president, now makes rate decisions with that table in view.
1946: the escape nobody noticed
The United States has carried a heavier load than this before, and the way it escaped is the most instructive chapter in the story. In 1946 the federal debt reached 119% of GDP. For every dollar the country earned that year, Washington owed a dollar and nineteen cents. That is a heavier load than today’s. What followed was not a default, and it was not a brutal round of slashed budgets. It was something quieter than either.
Washington, with the Federal Reserve’s cooperation, held interest rates near their wartime lows while consumer prices rose about 29% in the two years to mid-1948. A family that bought a $1,000 war bond got every dollar back, on time and in full. Those dollars simply bought about a fifth less than the ones they had lent. By 1951 the debt had fallen to 74% of GDP. More than a third of the burden was gone in five years, and none of it was repaid ahead of schedule. The debt did not shrink. The dollars did.
Economists later gave the maneuver a name, financial repression, and it remains the only proven exit from a debt of this size that did not run through default or depression.
Who paid last time
The 1946 escape had a cost, and it landed with precision. Savers paid it: households holding cash, bonds, and fixed pensions watched a slice of their wealth disappear each year without ever seeing a line item for it. Borrowers with fixed-rate mortgages came out ahead as inflation shrank their debts along with everyone’s savings. People who owned things that rose with prices, houses for instance, came through fine. Wage earners landed in between, their raises chasing the grocery bill.
None of this means history must repeat, and BullScope publishes descriptive research, not advice. But the books say what they say. The debt is about to start with a 4. The interest bill runs $3.8 billion a day. Nearly $7 trillion sits at the short end, set to get cheaper the moment rates fall. And the one time America climbed out of a hole this deep, it paid every lender back in full, in dollars that bought less. The economy did not outrun that debt. The dollar shrank beneath it.
Reading the numbers
Debt and interest figures come from the U.S. Treasury’s Fiscal Data service (Debt to the Penny, Aug 17, 2026; Monthly Statement of the Public Debt and average interest rates, July 31, 2026; interest expense, fiscal year to date through July 2026). Historical debt-to-GDP, GDP, and consumer prices come from Federal Reserve Economic Data (FRED). This article is descriptive research about public finances and history. It is not investment advice, and nothing in it is a recommendation to buy, sell, or hold anything.