For the past year and a half, the Federal Reserve has been trying to cool prices without tipping the economy into a ditch. Yesterday, two official reports landed on the same day, and they told a story that makes that job harder, not easier. Growth is slowing. Inflation is not.
Those two things should not coexist so stubbornly. Slower growth usually means less spending, and less spending usually means prices ease. Right now, that logic is breaking down, and the gap between what the economy is producing and what it still costs to live in it is the tension every saver and household is living inside.
The short version
The filed numbers show the economy growing at its slowest pace in over a year, while the inflation gauge the Fed watches most closely is running nearly double the Fed’s stated target. The market is pricing in a Fed that stays on hold. The open question is whether growth can keep slowing without tipping into something worse, while inflation refuses to follow it down.
One day, two contradictions
On August 26, 2026, the Bureau of Economic Analysis released two separate reports. The first was the second estimate of Q2 2026 GDP, confirming the economy grew at an annualized rate of 1.5% from April through June, down from the prior quarter and the weakest reading in over a year. The second was the July 2026 PCE inflation report, showing that the price index the Fed uses as its official inflation target rose 3.7% over the past year. Core PCE, which strips out food and energy because those prices swing wildly month to month, came in well above the Fed’s 2% target.
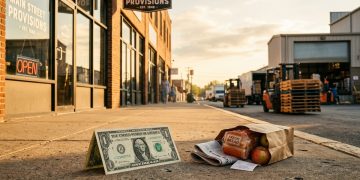
To put that in household terms: a family spending a thousand dollars a month on the basics is paying roughly thirty dollars more than the Fed considers acceptable, and that gap has not closed meaningfully in months.
As Olu Sonola, head of U.S. economics at Fitch Ratings, put it in commentary cited by Advisor Perspectives, the Fed “still has considerable ground to cover before markets see 2% inflation as a credible outcome rather than a distant aspiration.”
How we got here
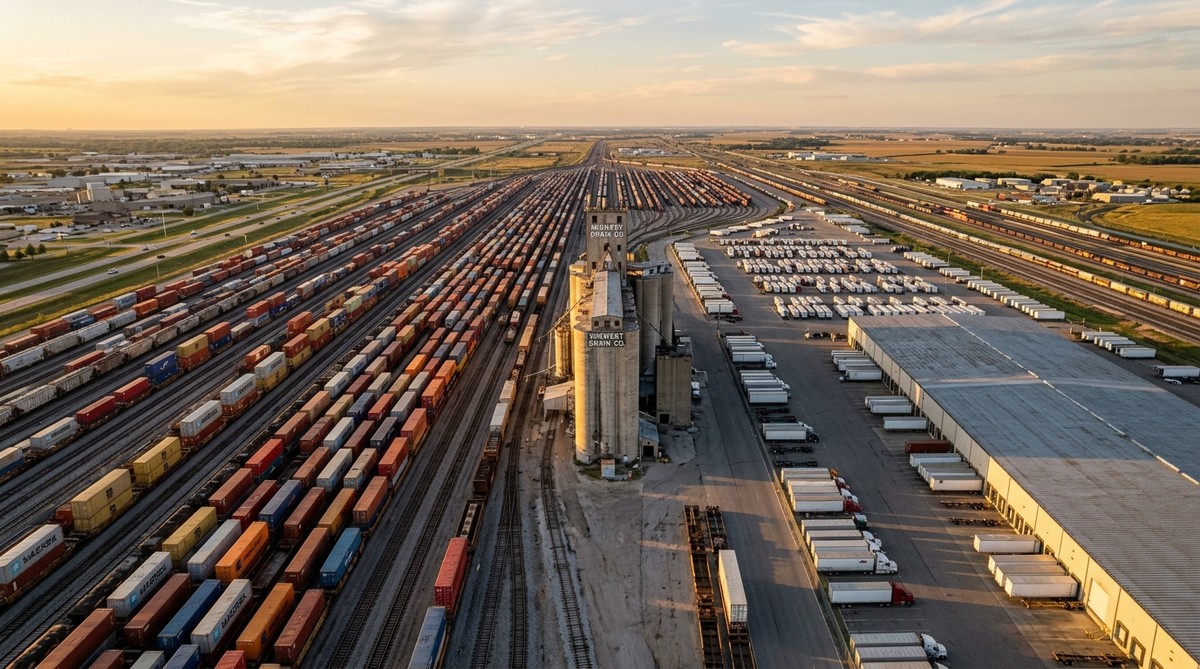
This moment has roots. Through late 2025, the Fed cut its benchmark interest rate three times in a row, a bet that inflation was beaten. The July PCE report suggests the bet was premature. Meanwhile, global shipping lanes stayed under pressure through 2026, with Red Sea disruptions and trade policy uncertainty pushing freight costs to their highest since late 2024, feeding prices from the supply side even as the Fed squeezed from the demand side.
The GDP revision added a wrinkle. Inside the Q2 report, the core PCE component was revised upward, meaning it came in hotter than the initial reading. XTB, in analysis cited by Advisor Perspectives, noted this suggests that much of the consumer spending keeping growth alive was driven by rising prices, not rising volumes. People are spending more and getting roughly the same amount. That is not the kind of growth that feels good on the ground.
The jobs picture: a crack, not a collapse
The labor market is where the two stories almost converge. The BLS reported on August 7 that nonfarm payrolls fell by 23,000 in July 2026, a rare monthly decline. The unemployment rate held at 4.1%, and the share of Americans either working or looking for work remained near recent norms. A single month of job losses is not a recession signal on its own, but it is the kind of reading that, combined with slowing GDP, starts to sketch a picture worth watching.
Weekly jobless claims, released by the Department of Labor this morning, came in at 208,000 for the week ending August 22, up slightly from the prior week. The level is still historically low, meaning most people who have jobs are keeping them. But the direction, ticking up alongside a payroll decline, is the kind of detail that matters more over the next few months than it does today.
Jeffrey Roach of LPL Financial, cited by Advisor Perspectives, observed that consumers are still benefiting from income growth outpacing inflation, though “services inflation remains elevated.” That is the narrow ledge the economy is walking: incomes ahead of prices, but not by much, and the margin is shrinking as growth slows.
Reading the numbers
- 1.5% annualized GDP growth, Q2 2026. This is how fast the whole economy expanded from April through June, expressed as if that pace ran for a full year. Think of it like a car’s speedometer: the car moved, but it slowed down from 2.1% in Q1. At 1.5%, the economy is growing roughly as fast as the population, meaning the average person is barely gaining ground. Source: BEA second estimate, August 26, 2026.
- 3.7% headline PCE, 3.3% core PCE, year over year, July 2026. PCE is the Fed’s preferred inflation measure, a broad gauge of what households actually pay for goods and services. Core strips out food and energy to show the underlying trend. A family that spent $10,000 on core expenses a year ago is spending roughly $10,330 today for the same things. The Fed’s target is $10,200. Source: BEA personal income and outlays, August 26, 2026.
- Minus 23,000 payrolls, July 2026. The economy shed jobs in July, the first monthly decline in recent memory. It is one data point, not a trend, but it arrives at the same moment growth is slowing, which makes it louder than it would be in isolation. Source: BLS, August 7, 2026.
- 208,000 initial jobless claims, week of August 22. About 208,000 people filed for unemployment benefits in a single week. For context, that is roughly the population of a mid-sized American city, filing in seven days. The level is low by historical standards, but it crept up from the prior week. Source: Department of Labor, August 27, 2026.
The math and the mood are pulling in opposite directions. The math, what filed data actually shows, is an economy losing momentum while inflation stays well above the Fed’s target. The mood, what markets appear to be pricing, is a Fed that sits still and waits. Those two readings leave the same open question: if growth keeps slowing and inflation does not follow it down, something eventually has to give, and savers watching both sides of that equation have reason to keep watching.
Sources
- BEA: GDP Second Estimate and Corporate Profits, Q2 2026
- BEA: Personal Income and Outlays, July 2026
- BLS: Little Change in Nonfarm Payroll Employment in July 2026
- Department of Labor: Initial Jobless Claims, week ending August 22, 2026
- Advisor Perspectives: Q2 GDP Second Estimate, August 26, 2026
- Advisor Perspectives: Fed Interest Rate Decision, July 29, 2026