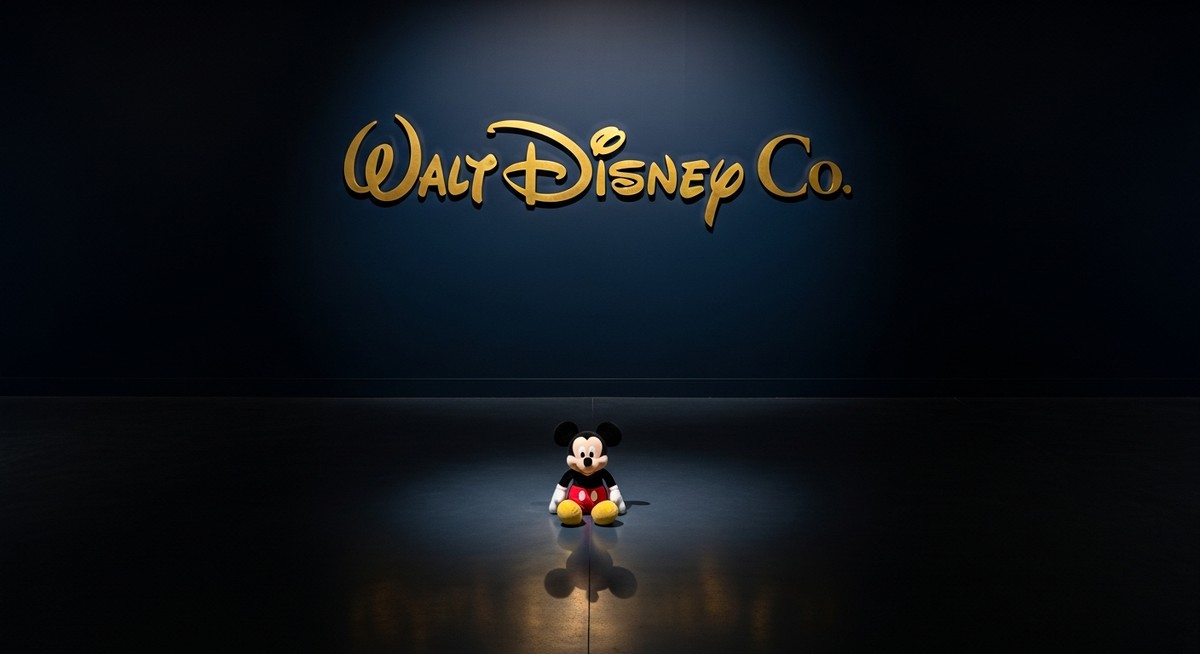
Six years ago, Disney was the most expensive media stock on earth, and investors were happy to pay for the dream. Then came a pandemic that shuttered every theme park, a streaming war that burned cash for years, and a leadership carousel that left the strategy in question. The stock peaked above $200 in early 2021 and has spent most of the time since sliding. Today it sits near $103, down roughly nine percent over the past year, while the filed numbers tell a story of a company that has quietly, methodically fixed itself.
That gap between a recovering business and a retreating stock is the tension worth examining.
In one breath
Disney’s 10-Q for the quarter ended June 27, 2026 shows earnings per share more than doubling in a single year, streaming turning its first real profit, and theme parks growing steadily. The stock trades at a price-to-earnings ratio near its lowest point in a decade, according to our data. Those two readings cannot both be right, and that disagreement is the story.
What the loudest voices are saying
After Disney’s fiscal third-quarter earnings landed on August 5, 2026, the analyst community moved quickly. Argus Research maintained a positive rating with a stated valuation level of $134 (MarketBeat, August 6, 2026). Wells Fargo raised its stated target to $132 under an Overweight rating, citing operational improvements in the earnings report. Benchmark, as reported by Barchart on August 10, reiterated a positive view at $115, pointing specifically to cruise line expansion as the driver. Barchart’s August 10 tally counted 32 analysts covering the stock, with a majority carrying positive ratings. Those figures reflect where outside analysts have set their own models; they are not BullScope’s assessment of fair value.
The common thread in that commentary: the market is pricing Disney as though the turnaround is fragile, while the filed numbers suggest it has already happened. That is the claim worth testing.
Testing the claim: what the filings actually show
Start with earnings. Disney’s 10-K for fiscal year 2025 reported earnings per share of $6.85, against $2.72 the year before. That is not a rounding difference; it is the kind of jump that happens when a business crosses from investment mode into harvest mode. The net margin, the share of each dollar of revenue that survives after every cost, reached 13.1% in fiscal 2025. Two years earlier it was 2.6%. A household spending a hundred dollars on Disney products and services in 2023 was effectively funding less than three dollars of profit; today that same hundred dollars funds more than thirteen. That is a structural shift, not a one-quarter fluke.
The most recent quarter confirms the direction. The Q3 2026 10-Q shows free cash flow, the actual dollars left after the company pays for its own upkeep and investment, growing 63% to $3.1 billion for the quarter. Free cash flow is the number that matters most for a company carrying significant debt, because it is what pays the bills and funds the buybacks. Disney’s is growing fast.
Three engines, and one that is sputtering
Disney runs three distinct businesses inside one stock. Understanding which is pulling and which is dragging explains a lot about why the mood around the company stays cautious even as the math improves.
Disney Experiences, the parks, resorts, and cruise lines, generated nearly ten billion dollars in revenue in the most recent quarter, with operating income up roughly a fifth. That is the engine that built Disney’s reputation for durable pricing power: families plan these trips a year in advance, pay upfront, and rarely cancel. Benchmark’s August 6 note specifically called out cruise expansion as a long-runway growth driver, and the filed numbers back that up.
Disney Entertainment, which now bundles streaming and traditional media, saw operating income jump 64% in the quarter to $1.7 billion. The combined Disney+ and Hulu streaming business posted $712 million in operating income for the quarter, more than double the same period a year earlier. This matters because streaming was the money pit that defined Disney’s difficult years: the company spent heavily to build the subscriber base, watched the stock get punished for the losses, and is now collecting the payoff. The pivot from growth-at-any-cost to profitable growth is filed, not promised.
Disney Sports, which is primarily ESPN, reported a meaningful drop in operating income for the quarter. Sports rights are expensive and the traditional cable bundle that funded ESPN for decades is shrinking. Disney launched a standalone ESPN streaming service in August 2025, but the transition is costing money now in exchange for a bet on direct subscriber relationships later. This is the genuine uncertainty in the story, and it is worth naming plainly: the data cannot yet tell us whether the ESPN pivot succeeds.
The debt question
Disney carries substantial long-term debt, but context matters: the debt-to-EBITDA ratio, a measure of how many years of operating earnings it would take to retire the debt, stands at 2.3 times. A household earning a hundred thousand dollars a year with two hundred thirty thousand dollars in mortgage debt is not in crisis; it is carrying a normal load and servicing it from income. With free cash flow of $3.1 billion in a single quarter, Disney is generating enough to pay off a meaningful slice of that debt every year, assuming no other uses. The load is real but the trajectory is manageable.
Disney has also committed to a substantial share buyback program for fiscal 2026, as reported after the August 5 earnings release. Buybacks reduce the number of shares outstanding, which mechanically lifts earnings per share even if total profits stay flat. Combined with the operating improvements, that is a meaningful tailwind to the per-share numbers.
Where the mood and the math diverge
Here is the core tension. Our data shows Disney’s price-to-earnings ratio, the price tag the market puts on each dollar of profit, sitting near 14.6 times. The decade median for this same ratio is 52.5 times. On this metric alone, the current ratio sits near the low end of its decade range, a gap that could reflect genuine risk, a lag in sentiment, or both, and that each reader can weigh against the open questions identified below. The price-to-sales ratio, what the market pays per dollar of revenue, sits modestly below its decade median as well.
The mood, what the market is currently paying, reflects a business still seen as transitional, still carrying the memory of streaming losses and leadership instability. The math, what the filed fundamentals show, reflects a business that has largely completed that transition. Morningstar’s data shows the EV/EBITDA ratio, a valuation measure that accounts for debt alongside market value, at roughly half its five-year average.
The gap is wide. Whether it closes depends on whether the ESPN transition lands, whether parks hold their pricing power through any economic softness, and whether streaming margins keep expanding. Those are open questions. What is not open is the direction of the filed numbers over the past two years.
Reading the numbers
- Net margin, FY2025: 13.1%. The net margin is what remains of each dollar of revenue after every cost, tax, and interest payment. Disney’s was 2.6% in fiscal 2023. The jump to 13.1% in fiscal 2025 means the company kept $13 of every $100 it earned, up from $2.60 two years earlier. That is not a tweak; it is a rebuild.
- Free cash flow, Q3 2026: $3.1 billion, up 63%. Free cash flow is the cash left after paying for operations and capital investment. It is the most honest measure of financial health because it cannot be massaged by accounting choices. A 63% increase in a single year, as filed in the Q3 2026 10-Q, means the business is generating substantially more real money than it was. A household that went from saving $300 a month to saving $489 a month has meaningfully changed its financial position.
- P/E ratio: 14.6 times, against a decade median of 52.5 times. The P/E ratio is the price tag per dollar of annual profit. At 14.6 times, the market is paying $14.60 for each dollar Disney earns, against a decade median of $52.50. Whether that gap represents undervaluation, a structural re-rating of media multiples, or unresolved risk around ESPN and parks pricing is the question the data alone cannot answer. The discount reflects real uncertainty about ESPN and the pace of recovery; it may also reflect a sentiment reading that has not yet incorporated two years of improving filings, or it may reflect risks the filed numbers do not yet capture, the data does not resolve which.
- Debt-to-EBITDA: 2.3 times. EBITDA is operating earnings before interest, taxes, and accounting deductions for depreciation. The ratio measures how many years of those earnings it would take to clear the debt. At 2.3 times, Disney would theoretically retire its entire long-term debt load in just over two years of operating earnings. That is a manageable burden for a business generating $3 billion in free cash flow per quarter.
Sources
- Disney 10-Q, quarter ended June 27, 2026 (SEC EDGAR)
- Disney 10-K, fiscal year ended September 27, 2025 (SEC EDGAR)
- Disney 10-K, fiscal year ended September 28, 2024 (SEC EDGAR)
- MediaPlayNews: Disney+ and Hulu Q3 2026 streaming profit
- MoreValYou: Disney streaming and buyback commentary, August 2026
- Barchart: analyst consensus on Disney, August 10, 2026
- MarketBeat: Argus Research analyst note, August 6, 2026
- MarketBeat: Q3 2026 earnings call highlights
- Morningstar: Disney valuation data