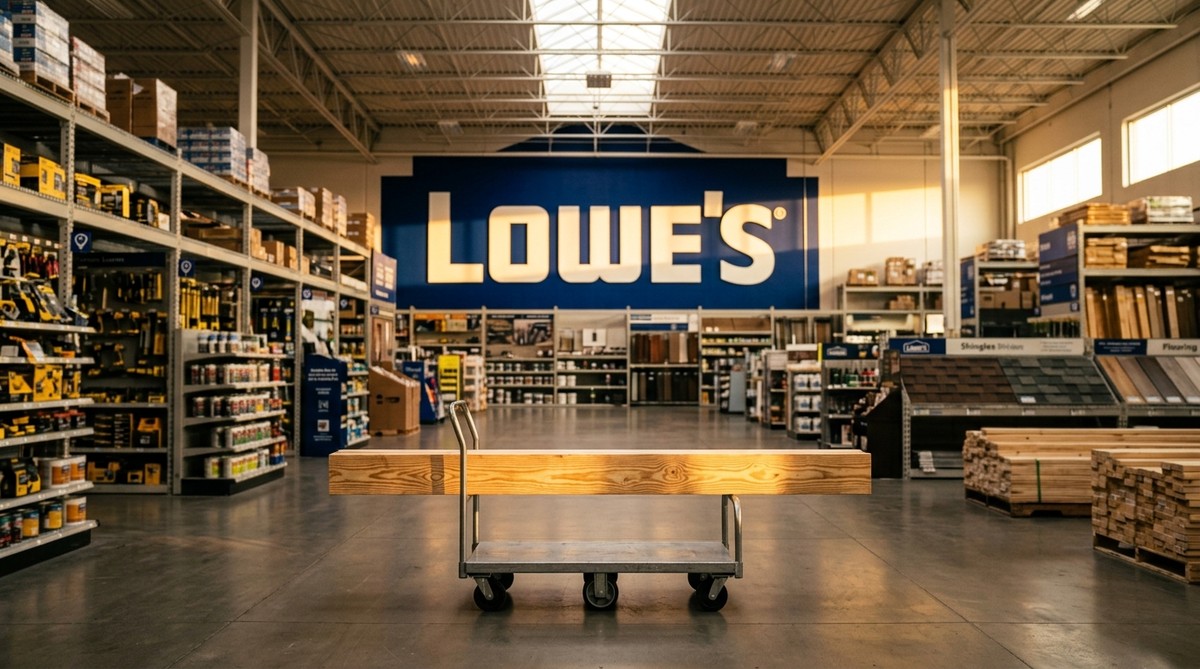
Six years ago, Lowe’s was the perpetual runner-up, a perfectly decent hardware chain that always seemed to be one step behind Home Depot. Then came the pandemic, a lumber-and-appliance buying frenzy, and a strategic overhaul that management called the “Total Home” strategy, a deliberate push to win over professional contractors rather than just weekend DIYers. Then the housing market stalled, mortgage rates climbed, and homeowners stopped calling contractors. Lowe’s revenue fell for two straight fiscal years. The stock followed.
Here is the part that should make a careful reader pause: the share price is sitting roughly 25% below its 52-week high, yet the most recent quarterly filing shows revenue up 10% from a year ago. A business shrinking and a stock falling makes sense. A business growing and a stock falling is a story worth reading carefully.
In one breath
The filed numbers show Lowe’s growing again, with its first meaningful revenue jump in three years. The stock is priced at a multiple, meaning the price tag per dollar of profit, that sits right at its own decade median, as if the growth isn’t happening. The open question is whether the margin compression that accompanied that revenue surge is a temporary cost of expansion or the beginning of something harder to fix. Those two readings cannot both be right, and that disagreement is the story.
The years that built the current position
The pandemic era was genuinely strange for home improvement retail. Lowe’s fiscal year 2021 10-K shows revenue reaching $96 billion, up from $90 billion the year before, as locked-down households poured money into their homes. Net margins hit nearly 9%, the best in the company’s modern history. The business looked transformed.
Then the hangover. When the Federal Reserve raised rates aggressively through 2022 and 2023, existing home sales collapsed, because a homeowner sitting on a low-rate mortgage has little reason to sell into a much higher-rate market. Fewer home sales mean fewer renovation projects. The fiscal year 2025 10-K shows revenue had slid back to $83.7 billion, erasing nearly all the pandemic gains in dollar terms. Earnings per share held up better than revenue, partly because Lowe’s was buying back its own shares steadily, which means each remaining share represents a larger slice of the same pie.
Management’s response was to double down on the Pro customer, the contractor who fills a truck every week rather than the DIYer who comes in twice a year. In early 2026, Lowe’s acquired Foundation Building Materials and Artisan Design Group, two moves aimed at embedding Lowe’s deeper into the professional supply chain. The bet is that Pro customers are less sensitive to housing-market mood swings than DIYers, who still make up the majority of revenue and remain the soft underbelly of the business.
What the latest filing actually says
The 10-Q filed May 28, 2026, for the quarter ended May 1, covers the first three months of fiscal 2026. Total revenue came in at $23.1 billion, up 10% from the same quarter a year earlier. That is the fastest quarterly growth rate Lowe’s has posted since the pandemic surge. Online sales grew at a meaningfully faster clip than the overall business, powered partly by AI-driven search and recommendation tools the company has been building out.
The complication sits in the margin line. A gross margin is what’s left of each dollar of sales after the direct cost of the goods sold. Lowe’s gross margin for the quarter slipped by about seven-tenths of a percentage point from the prior year. On revenues of this scale, that fraction translates to roughly $160 million less profit than the same sales mix would have generated a year ago. The acquisitions brought revenue but also brought lower-margin product categories into the mix, which is the most likely mechanical explanation.
Net income for the quarter was $1.63 billion, essentially flat with the prior year despite the revenue jump. Think of it this way: the store rang up 10% more sales but kept about the same amount after all the bills. That is not a disaster, but it is a signal that growth is currently costing something.
The cash picture is more straightforward. The company generated enough operating cash in a single quarter to cover capital expenditures several times over and still have money left over. Long-term debt is large in absolute terms, but Lowe’s generates enough cash each year to service it without strain, and the company reported several billion in unused revolving credit, a backstop that matters when acquisition activity is elevated.
The math and the mood
“The math” is what the filed fundamentals justify. “The mood” is what the market is currently paying. Right now, those two things are sitting in an unusual place relative to each other.
Our data shows Lowe’s trading at a P/E ratio, the price per dollar of annual profit, of about 18.4. The company’s own decade median P/E is 18.5. In other words, the market is pricing Lowe’s exactly as it has priced it on a typical day over the past ten years, right at the midpoint of its own valuation history. That is the mood: indifferent, neither excited nor alarmed.
The math says something slightly different. Revenue just grew at a double-digit rate in a quarter when the housing market is still sluggish. Comparable sales, a measure of growth at stores open at least a year rather than growth from new locations, turned positive in Q1 2026, and management’s full-year guidance calls for continued modest comparable-sales growth. The acquisitions add revenue that didn’t exist before. If margins stabilize as the acquired businesses are integrated, the earnings picture could look meaningfully different by the end of the fiscal year than it does today.
The tension is that “if.” Margin compression during an acquisition phase is normal and often temporary. It can also be the first sign that a company overpaid or took on more complexity than it can digest. The filed numbers alone cannot answer which story this is.
MarketBeat reported on August 17, 2026 that Bernstein and Piper Sandler each trimmed their price targets ahead of the Q2 earnings release scheduled for August 19, citing expectations of mixed results and soft demand for large remodeling projects. These are not downgrades, just recalibrations, and they reflect the same margin question the filing raises. TIKR’s analysis after Q1 argued that the margin dip is being treated as permanent when the filed evidence for that conclusion is limited, a view that sits on one side of the open margin debate this article describes.
The Q2 report scheduled for August 19, 2026 will be the next filed data point on whether the margin trend is improving or deteriorating. We don’t have those numbers yet, and any article written before a filing is working with incomplete information. That is worth stating plainly.
Reading the numbers
- Revenue, Q1 2026: $23.1 billion, up 10%. What it is: total sales for the quarter ended May 1, 2026, per the 10-Q filed May 28, 2026. What it means here: the first double-digit quarterly growth since the pandemic era, driven partly by acquisitions and partly by organic demand. In everyday terms: a store that was ringing up $100 an hour a year ago is now ringing up $110. The register is busier. Whether that extra $10 is profitable is the next question.
- Gross margin, Q1 2026: 32.7%, down from 33.4% a year earlier. What it is: the share of each sales dollar left after paying for the goods sold. What it means here: the revenue growth came with a cost, likely the lower-margin product mix from new acquisitions. In everyday terms: a bakery that used to keep 33 cents from every dollar of bread sales is now keeping 32.7 cents, because it started selling wholesale flour at thinner margins to grow faster.
- Diluted EPS, Q1 2026: $2.90 reported, $3.03 adjusted. What it is: profit per share, per the Q1 2026 earnings release. What it means here: the adjusted figure beat analyst expectations, which is why the stock didn’t fall further after the report. In everyday terms: a worker expected to bring home $2.95 this week brought home $3.03. Small difference, but it matters when expectations are the benchmark.
- P/E ratio: 18.4, at the 49th percentile of Lowe’s own decade history. What it is: the price tag per dollar of annual profit, compared to where that same ratio has sat over the past ten years, per our data. What it means here: the market is paying a price consistent with its decade median for a business that is currently growing faster than that median. In everyday terms: a rental property that used to generate $1,000 a month is now generating $1,100, but the asking price hasn’t moved. Whether that gap narrows through price, through earnings, or through a reversal of the growth trend is the open question the filed numbers cannot yet answer.
- Long-term debt: $36.8 billion. What it is: borrowed money due beyond one year, per the Q1 2026 10-Q summary. What it means here: large, but Lowe’s generated more than $3 billion in operating cash in a single quarter, so the debt is manageable at current earnings levels. The risk is if earnings fall sharply while the debt stays fixed.
For the standing yardsticks on Dow: the price tag, the filed record, and the four gauges, refreshed with each edition, see the BullScope Evidence Sheet: Dow.
Sources
- Lowe’s 10-Q, quarter ended May 1, 2026 (SEC EDGAR)
- Lowe’s 10-K, fiscal year ended January 30, 2026 (SEC EDGAR)
- Lowe’s 10-K, fiscal year ended January 31, 2025 (SEC EDGAR)
- Lowe’s 10-K, fiscal year ended February 2, 2024 (SEC EDGAR)
- Lowe’s Q1 2026 press release (corporate.lowes.com)
- TradingView: Lowe’s Q1 2026 EPS summary
- StockTitan: Lowe’s Q1 2026 10-Q summary (cash flow and debt)
- MarketBeat: Lowe’s analyst consensus, August 17, 2026
- TIKR: Lowe’s valuation after Q1 margin compression
- Distribution Strategy Group: Lowe’s Pro segment expansion, May 2026