For most of the past two years, the freight industry has been working through a hangover. The pandemic buying binge flooded warehouses, carriers over-expanded, and then demand fell away. Trucking rates collapsed. Rail volumes went sideways. The question heading into summer 2026 was whether the recovery was real or just a tariff-driven sugar rush. The numbers arriving this month are starting to answer that.
Almost everything Americans buy moves through at least one of three systems before it reaches a shelf: a truck, a train, or a ship. When those systems speed up together, businesses are restocking and consumers are spending. When they diverge, something more complicated is happening. Right now, they are diverging, and that gap is the story.
Trucks: two steps back
The ATA’s For-Hire Truck Tonnage Index for May 2026, released June 23, recorded its second consecutive monthly decline. Think of the index as a scale under the nation’s trucking fleet: it has been ticking down two months running, after a similar slip in April. The June reading won’t arrive from the ATA until around July 21, so May is the freshest evidence we have.
On an annual basis the trend is still positive, May tonnage edged ahead of the same month last year, and the first five months of 2026 ran modestly above the same stretch in 2025. But the recent direction is softer. For anyone watching earnings from retailers and consumer-goods companies this quarter, a trucking index that’s slipping month-to-month is a signal worth noting: it often means businesses are ordering less, not more.
Rail: a different picture entirely
Rail tells a sharply different story. The Association of American Railroads reported that for the week ending June 27, total U.S. rail traffic was up solidly from the same week in 2025. Intermodal volume, containers and trailers moving by rail rather than truck, jumped 10.1% year over year, one of the stronger single-week readings in recent memory.
That intermodal number matters because it’s a proxy for imported consumer goods moving inland from ports. A surge of that size suggests retailers were pulling freight off ships and routing it fast. Through the first half of 2026, cumulative rail volume ran well ahead of the prior year. Rail and trucking are often complementary: goods come in by ship, move inland by rail, and finish the journey by truck. When rail surges while trucking softens, it can mean the import wave is arriving faster than domestic distribution can absorb it.
Ports and ocean rates: the front-loading signal
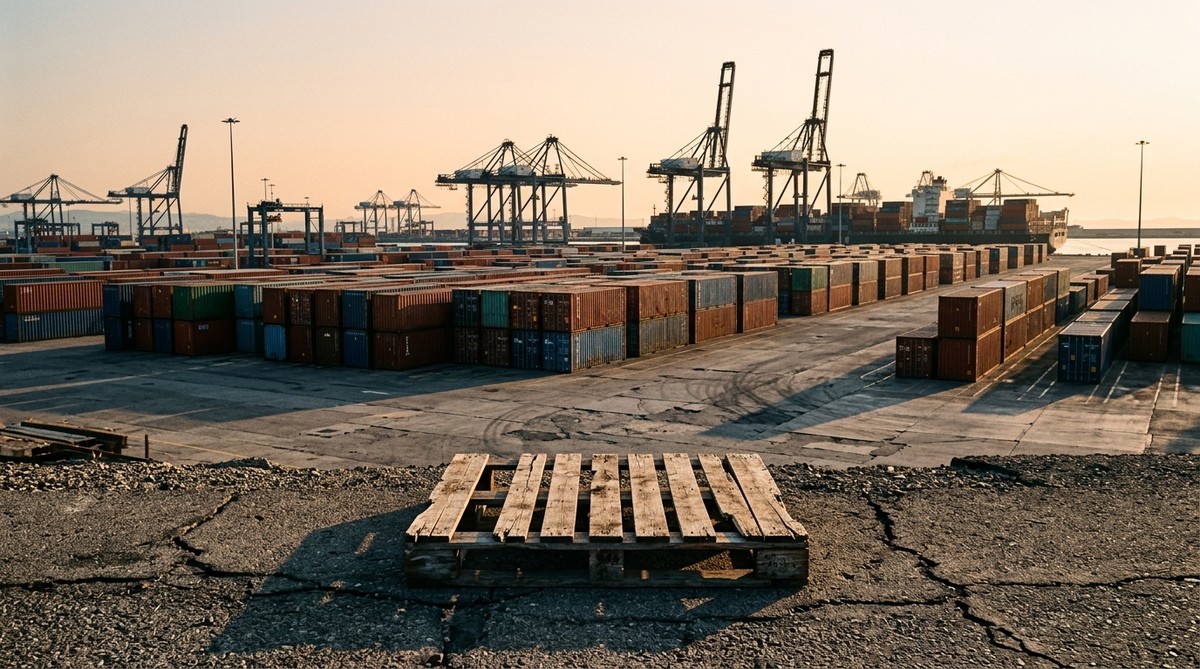
The port data explains why rail is so busy. U.S. seaports collectively handled about 2.4 million container units in June 2026, up sharply from a year earlier. The Port of Long Beach recorded its third busiest June on record. Importers were clearly rushing goods in ahead of anticipated tariff increases and higher fuel costs.
Ocean freight rates confirm the urgency. Xeneta data from late June showed Asia-to-U.S. spot rates at levels that reflect carriers adding peak-season surcharges on top of already elevated base rates. When shippers pay that much to move a box, they’re betting the cost of waiting is higher still. That’s a tariff-anxiety trade, not a demand-driven one, and the distinction matters for reading what comes next.
The Cass Freight Index for May, released around July 13, registered its shipments component just barely above its baseline, and slightly below May 2025. That gentle decline in overall shipment counts, even as port volumes surge, points to the same tension: the import boom is real, but underlying domestic freight demand is not accelerating to match it.
Reading the numbers
ATA Truck Tonnage Index: 114.4 in May 2026, down 2% month over month. The index measures the weight of freight hauled by for-hire truckers, adjusted for seasonal patterns. A reading of 114.4 means the fleet is moving about 14% more tonnage than in the index’s base year. Two consecutive monthly declines mean the trend is pointing down even if the year-over-year comparison is still slightly positive. In everyday terms: if trucking were a conveyor belt at a warehouse, the belt is still moving faster than it was a year ago, but someone has turned the dial down two months in a row.
Rail intermodal volume: up 10.1% for the week ending June 27, 2026. Intermodal means a container that travels part of its journey by ship, part by rail, and part by truck. A 10% jump year over year is large. If your local store received 100 shipments by this method last June, it received the equivalent of 110 this June. That’s a meaningful acceleration, driven largely by imports rushing inland from coastal ports.
Cass Freight Index Shipments: 1.013 in May 2026, down 1.1% year over year. The Cass index tracks the number of freight shipments across all modes, not just trucks. A reading just above 1.0 means shipment counts are barely above the index’s baseline. A year-over-year decline, even a small one, while port volumes are surging, suggests the import wave is concentrated rather than broad-based. Think of it as a busy front door but quiet back rooms.
What to watch next
The fundamentals point to front-loaded imports masking softer domestic demand, while the mood in ocean freight, reflected in rates near multi-year highs, says shippers still expect supply to tighten. The tension resolves when the ATA releases June trucking tonnage around July 21: if that number bounces back, the domestic economy absorbed the import wave. If it falls a third consecutive month, the warehouses are filling up again and retailers may pull back orders heading into autumn, which would show up in third-quarter earnings guidance.
Sources
- ATA Truck Tonnage Index, May 2026 release
- Logistics Management: ATA May tonnage report
- Association of American Railroads, week ending June 27, 2026
- Cass Freight Index Shipments, May 2026
- U.S. container imports, June 2026
- FreightWaves: Port of Long Beach, June 2026
- Xeneta ocean rate update, June 25, 2026
- Freightos Baltic Index, June 9, 2026