
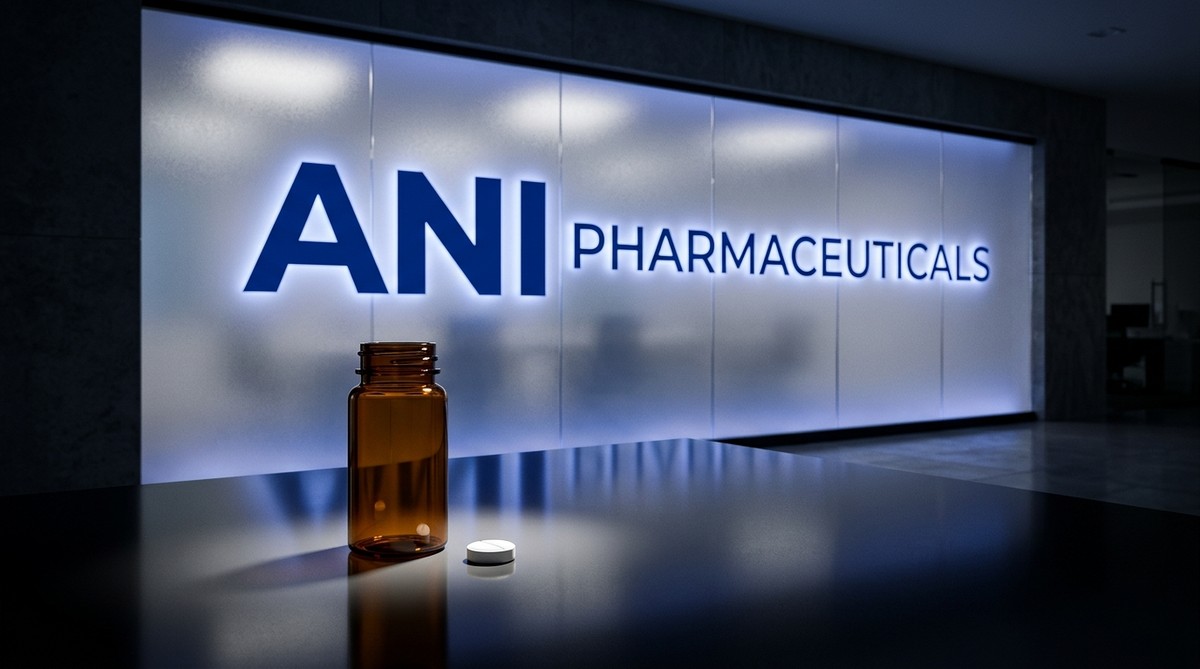
Three years ago, ANI Pharmaceuticals was losing money on nearly every dollar it brought in. Today it is generating real profit, growing revenue faster than almost any company in its peer group, and sitting on more cash than it owes on its biggest loan. The stock is down almost 20% over the past year anyway. That gap between what the business is doing and what the market is paying for it is the whole story.
This is the first time BullScope has covered ANI directly, so there is no prior call to grade. What we can do is lay the filed numbers next to the current price and let the reader see the tension for themselves.
The short version
ANI’s filed revenue has roughly quadrupled since 2021, and the company turned its strongest profit in 2025, with a net margin of 8.9% that dwarfs the brief 3.9% margin posted in 2023 and the losses recorded in every other year of this data set. The stock trades at a price-to-sales ratio in the bottom 3% of its own decade range, meaning the market is paying less per dollar of revenue today than it has almost any time in ten years. The open question is whether the market is pricing in a real risk to that revenue, or whether the valuation gap reflects factors the filed numbers do not yet capture.
From a money-loser to a margin story
ANI spent most of the early 2020s doing what small pharmaceutical companies do: spending heavily to build something bigger than itself. The company acquired Cortrophin Gel, a decades-old drug used to treat inflammation, and spent years and considerable cash persuading doctors and insurers to use it again. That bet looked shaky for a while. The 2023 10-K showed a net margin of less than 4%, meaning the company kept less than four cents of profit from every dollar of sales. The 2024 10-K showed the margin slipping back into the red.
Then 2025 arrived. The 2025 annual filing shows revenue of $883 million, up 44% from the year before, and a net margin of nearly 9%. That is the difference between a company still proving its model and one that has proved it. For context: a business earning nine cents on every dollar of sales is not a miracle, but for a pharmaceutical company that was losing money two years earlier, it is a meaningful turn.
The Cortrophin Gel bet is the engine. That single product posted a dramatic year-over-year jump in the second quarter of 2026, according to the Q2 2026 10-Q filed August 7, 2026. ANI also sells a generics business, which launches a steady stream of new products each year and provides a lower-margin base. The rare disease side, led by Cortrophin, is where the growth and the margin live.
A company’s operating income, the profit left after paying the bills of running the business but before interest and taxes, tells you whether the core operation is healthy. In Q2 2026 that figure was $40 million, compared to $14 million in Q2 2025. That is not a rounding error. It means the business is becoming more efficient as it grows, which is the pattern investors in this sector pay up for.
The balance sheet has quietly become a strength
ANI carried heavy debt while it was building Cortrophin’s commercial presence. That debt did not disappear, but the company’s cash position has grown faster than most observers expected. As of the most recent filing, the company held more cash than it owes on its primary term loan. The convertible notes, a separate instrument where lenders can eventually swap their debt for stock, add a further layer to the liability side. But the net leverage ratio, a measure of debt relative to operating earnings, stood at roughly 1.0 times as of the Q2 filing date, according to Investing.com’s transcript of the Wells Fargo conference. A ratio of 1.0 means the company could theoretically pay off its net debt in about a year of operating earnings, a comfortable position for a company this size.
In May 2026, the board authorized a $100 million share repurchase program valid through 2029, per the 8-K filed that month. A buyback authorization is sometimes interpreted as a signal that management views the stock as undervalued relative to their internal outlook; it is one data point among several, and its significance depends on whether the authorization is actually executed and at what pace.
What the market is paying, and what it has paid before
Here is where the math and the mood diverge. “The math” is what the filed fundamentals show the business is doing. “The mood” is what investors are currently willing to pay for each dollar of that output. Right now, those two readings are unusually far apart.
Our data shows ANI’s price-to-sales ratio, the amount investors pay for each dollar of annual revenue, sitting well below its decade average. Over the past ten years, the market has typically paid significantly more for every dollar of ANI’s annual sales than it does today. That ratio sits in the bottom 3% of its own ten-year range, meaning the stock has been priced this cheaply, relative to its own revenue, only about three times in a hundred months.
The price-to-earnings picture tells a similar story. ANI spent most of the past decade losing money, so long-run medians are distorted by years when earnings were negative or tiny. What matters now is that the company is generating consistent profit for the first time, and the market’s current multiple does not reflect that shift. A business that has crossed from loss-making to genuinely profitable has historically commanded a higher price per dollar of earnings than one still proving itself; whether ANI’s current multiple reflects a lag in recognition or a market judgment about the durability of the profit is the open analytical question.
Ticker Nerd reported on September 14, 2026 that seven of eight analysts covering the stock have published buy-equivalent ratings, with published price estimates ranging from $90 to $119; those are their own opinions, listed for context, and BullScope neither adopts nor endorses them. Leerink Partners published an outperform-equivalent rating and a $104 price estimate on September 9, 2026, attributing the view to the Cortrophin Gel opportunity in acute gout; that opinion is Leerink’s own and is reproduced here as a data point about sell-side coverage, not as BullScope’s view. Published estimates from covering analysts ranged from $90 (neutral-equivalent) to $119 (buy-equivalent) as of August–September 2026; those figures are the analysts’ own and are noted here solely to characterize the range of sell-side opinion. The filed numbers show a valuation gap relative to historical norms; whether that gap reflects unpriced risk or an unrecognized fundamental shift is the question the data raises but does not resolve.
The most credible explanation the data supports is payer risk. Cortrophin Gel is an expensive drug, and insurers can restrict access or demand rebates that compress the revenue ANI actually collects. The dossier flags this as the primary identified risk. If payers push back harder in the second half of 2026, the full-year revenue guidance reaffirmed in the May 8 8-K becomes harder to hit. The generics business provides some cushion, but it runs at lower margins and cannot fully replace a shortfall in Cortrophin.
Reading the numbers
- Q2 2026 net revenue: $266 million, up 26% year over year. What it is: total sales for the three months ended June 30, 2026, per the Q2 10-Q. What it means: the business is growing at roughly five times the pace of the broader U.S. economy. Worked example: a local bakery doing $200,000 a year in sales growing at this rate would be doing $252,000 a year later.
- Q2 2026 operating income: $40 million, versus $14 million a year earlier. What it is: profit from running the business before interest and taxes. What it means: the core operation nearly tripled its profitability in twelve months, suggesting the revenue growth is not just volume but improving efficiency. Worked example: a business that kept $7 of profit from every $100 of sales a year ago is now keeping roughly $15.
- Cash of $360 million versus term loan of $305 million. What it is: the company holds more in cash than its primary debt obligation. What it means: ANI could pay off its biggest loan tomorrow and still have money left. A household analogy: a family with $36,000 in savings and a $30,500 car loan is in a different position than one with $5,000 in savings and the same loan.
- Price-to-sales ratio of 2.1, decade percentile of 3. What it is: our data computes this as the stock price divided by annual revenue per share. What it means: the market is pricing each dollar of ANI’s revenue more cheaply than it has in almost any month over the past ten years. Whether that is a signal or a warning depends on whether the revenue holds.
- FY2025 net margin of 8.9%, versus losses in 2021, 2022, and 2024, and a slim 3.9% margin in 2023. What it is: the share of each revenue dollar that became profit after all costs, per the 2025 10-K. What it means: the business crossed from loss-making to genuinely profitable last year. That crossing matters because it changes which valuation tools apply.
Sources
- 10-Q for quarter ended June 30, 2026 (SEC EDGAR)
- 10-Q for quarter ended March 31, 2026 (SEC EDGAR)
- 10-K for fiscal year ended December 31, 2025 (SEC EDGAR)
- 10-K for fiscal year ended December 31, 2024 (SEC EDGAR)
- 10-K for fiscal year ended December 31, 2023 (SEC EDGAR)
- 8-K filed May 8, 2026, guidance and buyback authorization (StockTitan)
- 8-K filings index (StockTitan)
- ANI Pharmaceuticals at Wells Fargo conference transcript (Investing.com)
- Leerink Partners outperform initiation, September 9, 2026 (MarketBeat)
- Analyst consensus summary, September 14, 2026 (Ticker Nerd)
- ANIP stock overview (Stock Analysis)